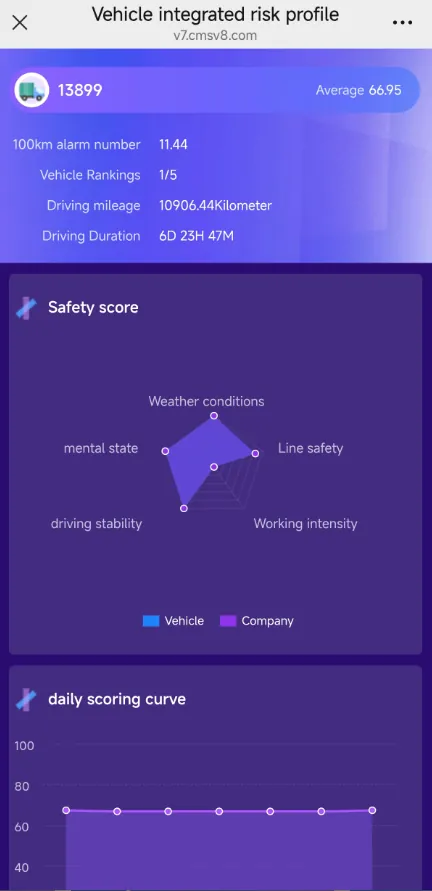
1. Function description
- Support querying by multiple time dimensions of day, week, and month. The report is based on multidimensional driving data (alarms, fatigue, weather, etc.) and scored and rated on a percentage scale. It visually displays the current status of vehicle driving safety and compares it with the company's average through radar charts and trend charts.
- Support scanning code to view mobile terminal reports, comprehensively assisting the fleet to accurately control risks.
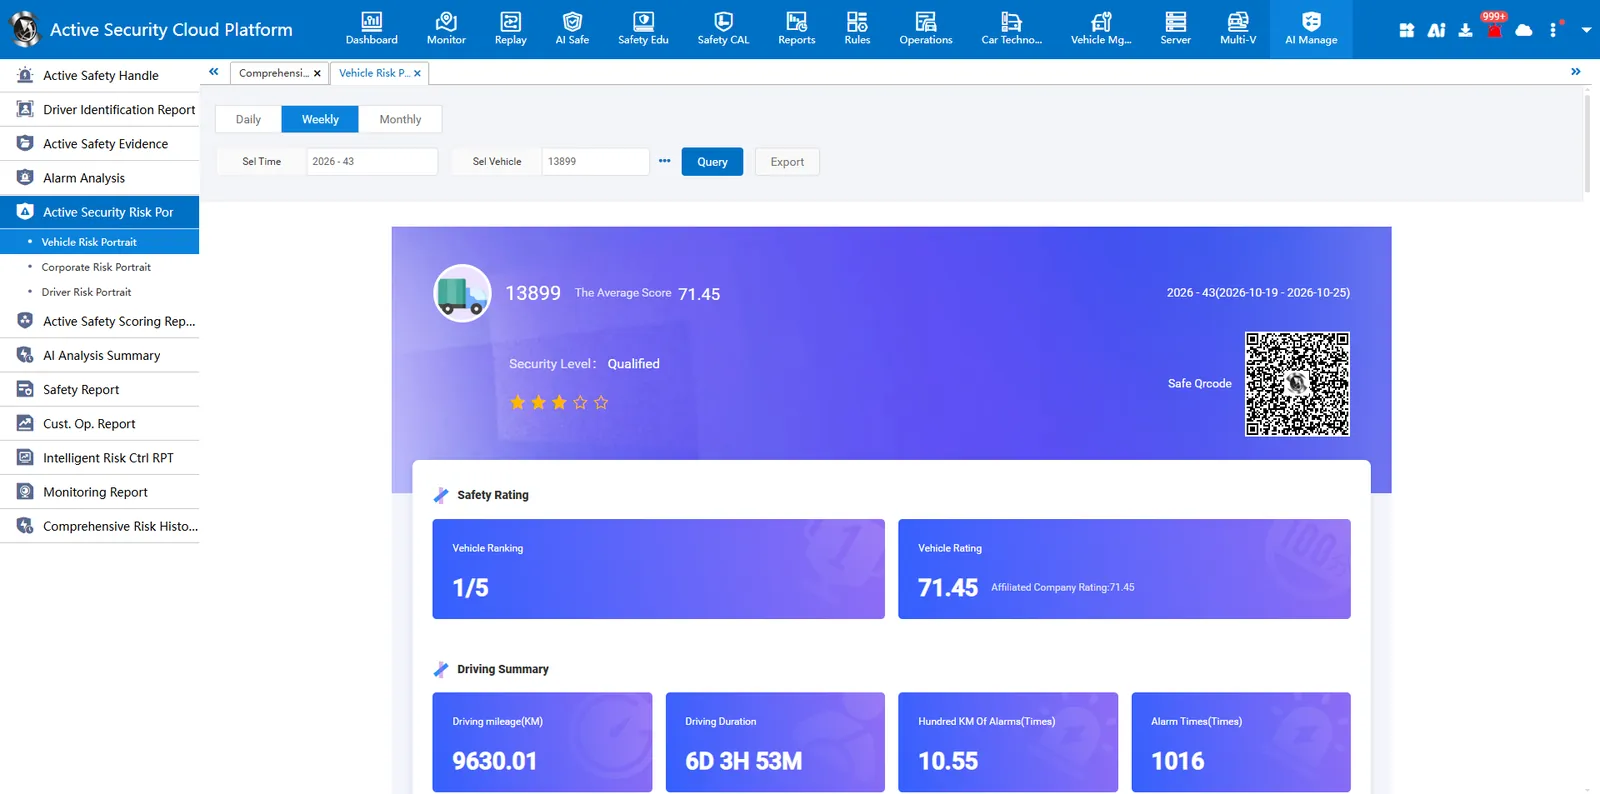
2. Report Description
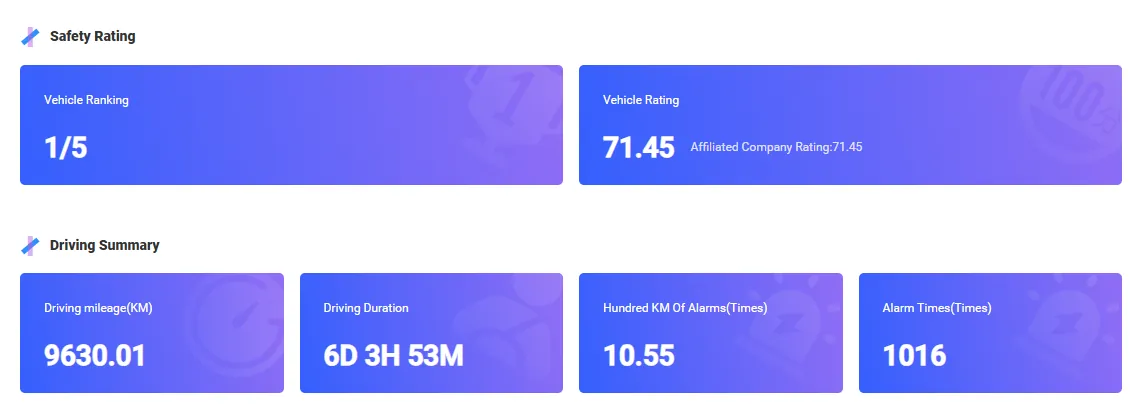
2.1 Safety Rating and driving summary
Safety Score: Shows the vehicle's overall safety score, fleet ranking, and comparison to the company's average score
Driving summary: display the core original data such as driving mileage, driving duration and alarm times of the vehicle, which is the calculation basis for each score deduction.
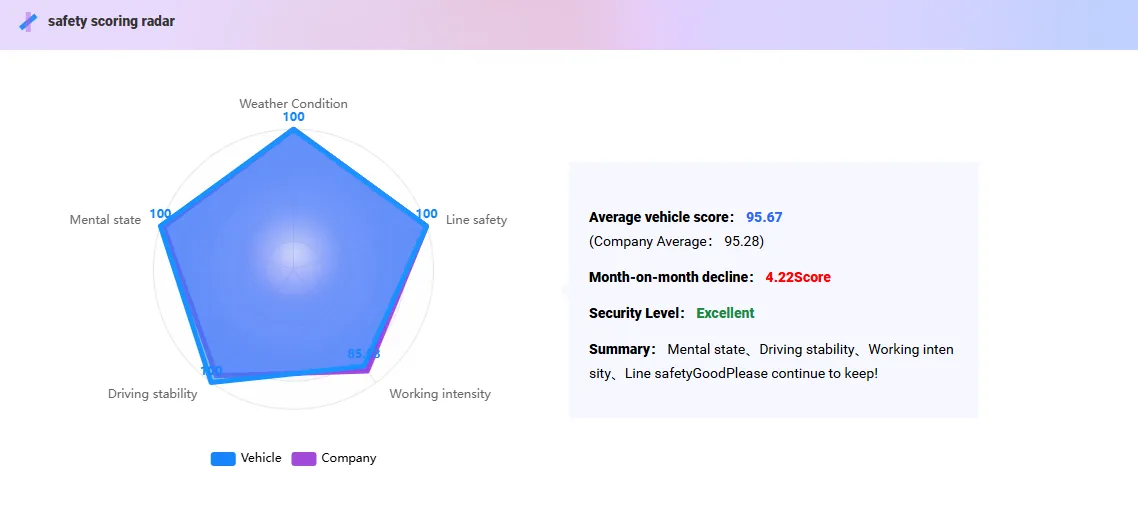
2.2 safety scoring radar
- The safety score is based on the analysis of multi- dimensional driving behavior data to comprehensively evaluate the safety status score of the vehicle and the driver. The score is divided into full marks by 100 (the higher the score, the safer it is). Points are deducted through various risk behaviors, and the average vehicle score is finally obtained. The safety level is divided according to the score, and the safety comments are summarized.
- ** Safety level: unqualified (0-59); Qualified (60-79); Good (80-89); Excellent (90-100) **
- ** Safety star: 1 star (0-59);2 stars (60-69);2 stars (70-79);4 stars (80-89);5 stars (90-100) **
- The score is displayed through five core dimensions, namely: driving stability, mental state, weather conditions, line safety, and work intensity.
Score calculation logic
The system background stores the security value (full score 100-deduction items), and the larger the score, the safer it is. The deduction logic for each dimension is as follows:
- Deduct points for alarm risk (corresponding to radar chart: driving stability, mental state and line safety)
The system deducts points according to the number of 100 kilometers alarm. If the actual mileage is less than 100 kilometers, it is calculated as 100 kilometers.
High risk alarm: 1 point/time
Medium risk alarm: 0.5 points/time
Low risk alarm: 0.25 points/time
Calculation formula: number of alarms × (100,000/mileage) × deduction value for single alarm
Note: 100,000 means 100 kilometers (if the mileage unit is meters). That is, after calculating the number of 100-kilometer alarms, multiply by the corresponding deduction value.
- Deduct points for weather risks (corresponding to radar chart: weather conditions)
The system deducts points according to the driving time of the vehicle in bad weather:
Low risk alert: 1 minute/hour
Medium risk warning: 2 minutes/hour
High risk warning: 5 minutes/hour
- Deduct points for driving intensity (corresponding to radar chart: working intensity)
The system deducts points for fatigue according to the daily continuous driving time:
Driving duration> 4 hours: (seconds exceeding 4 hours x 5 minutes) / 3600
Driving time> 7 hours: 15 minutes (seconds exceeding 7 hours x 10 minutes) / 3600
- Comprehensive safety value calculation
After calculating the independent deduction value (the maximum deduction of 100 points for each risk), the weighted accumulation is carried out according to the proportion of different dimensions set by the system.
Comprehensive formula: safety value = 100 - (cumulative sum of deduction points × proportion of each item)
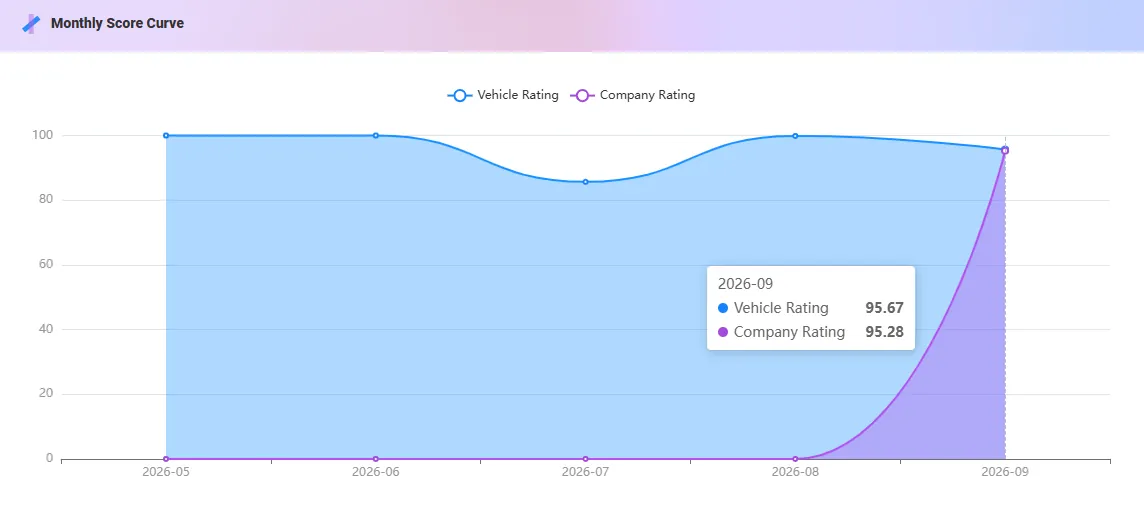
2.3 Score Curve
Shows the long-term trend of vehicle ratings versus company average ratings over time
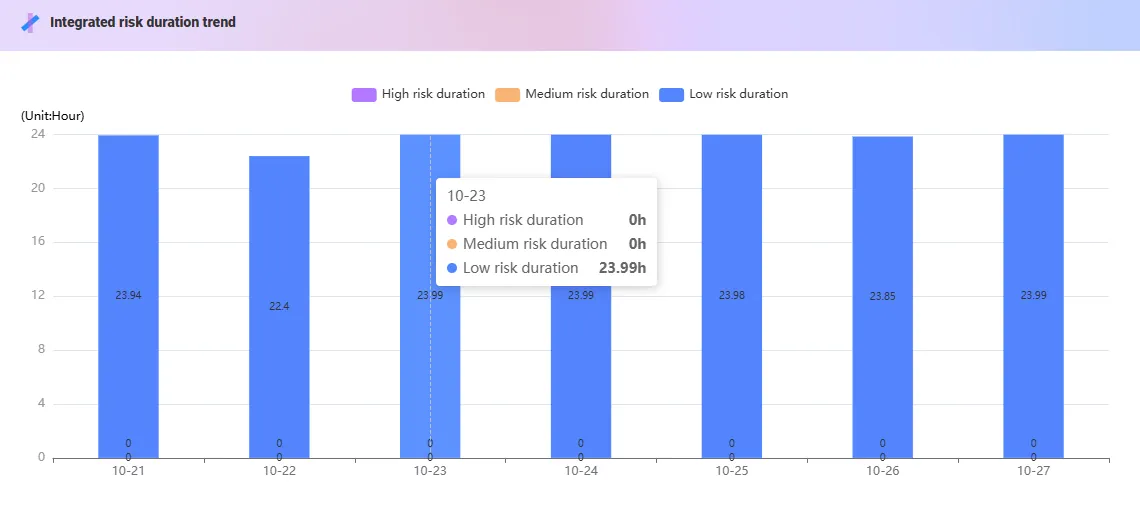
2.4 Integrated risk duration trend
Demonstrate the composition of risky driving time when the vehicle is in a high, medium and low risk state
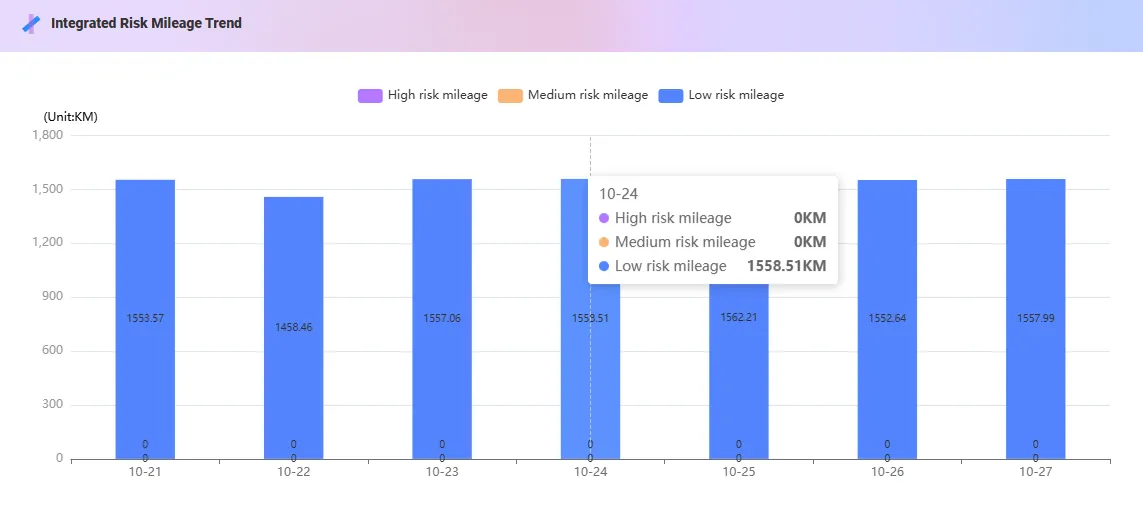
2.5 Integrated Risk Mileage Trend
Show the composition of risk driving mileage when the vehicle is in high, medium and low risk status.
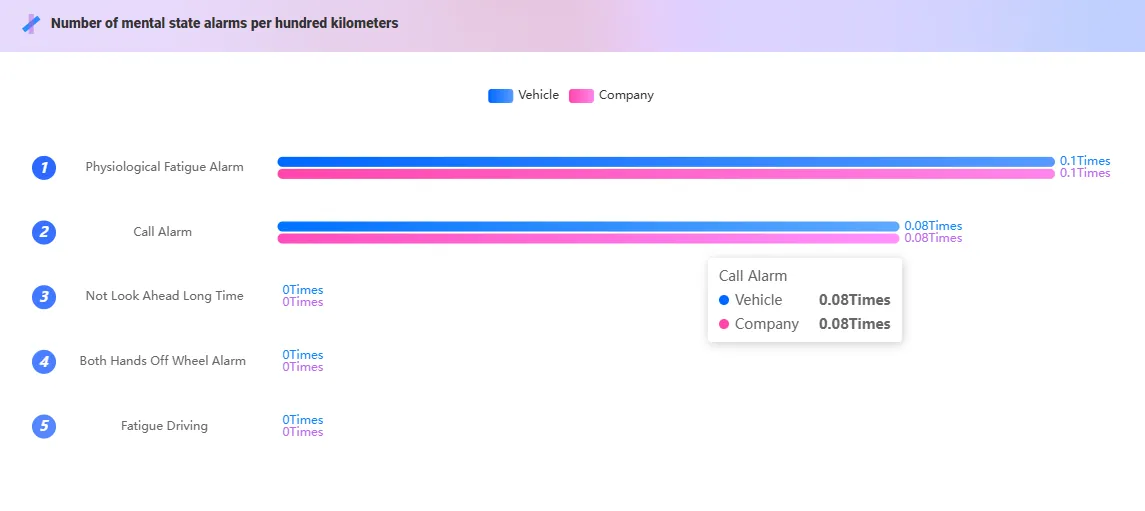
2.6 Number of mental state alarms per hundred kilometers
Show the 100-kilometer alarm frequency of various mental state risks such as vehicle fatigue driving, physical fatigue, answering and making phone calls, and compare them with the company's average data.
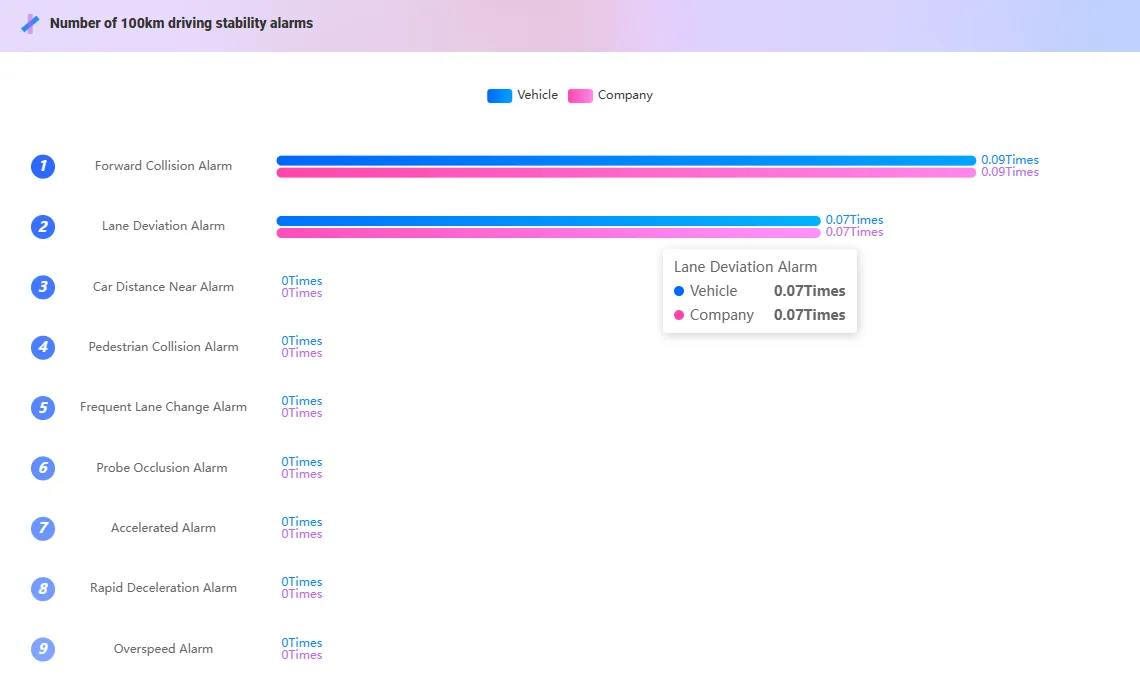
2.7 Number of 100km driving stability alarms
Show the 100km alarm frequency of various driving stability risks such as vehicle speeding, forward collision, lane departure, rapid acceleration and deceleration, and compare it with the company average.
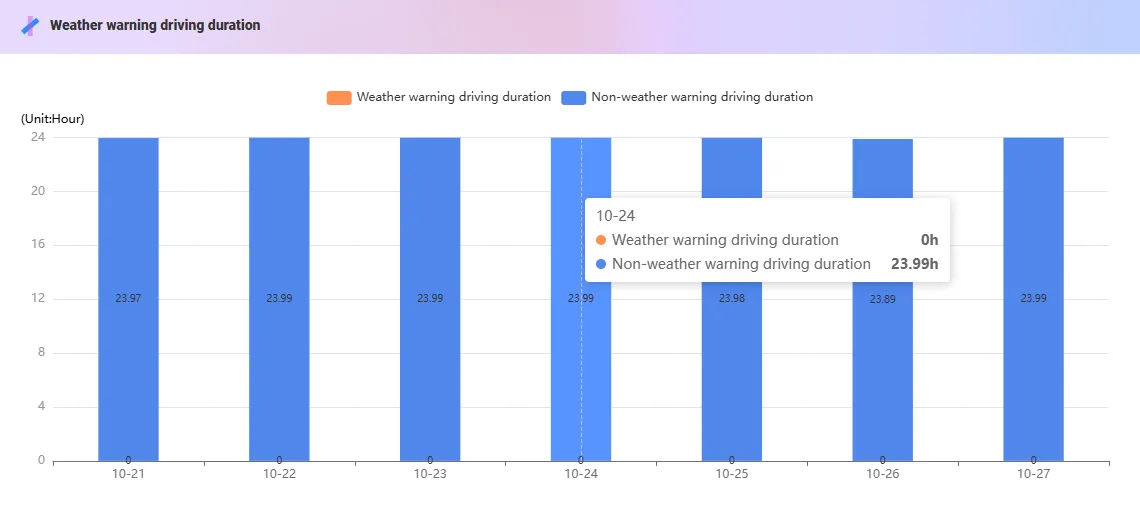
2.8 Weather warning driving duration
Show the comparison of the specific driving time of the vehicle in the "weather warning" and "non-weather warning" states, and intuitively reflect the degree to which the vehicle is affected by bad weather.
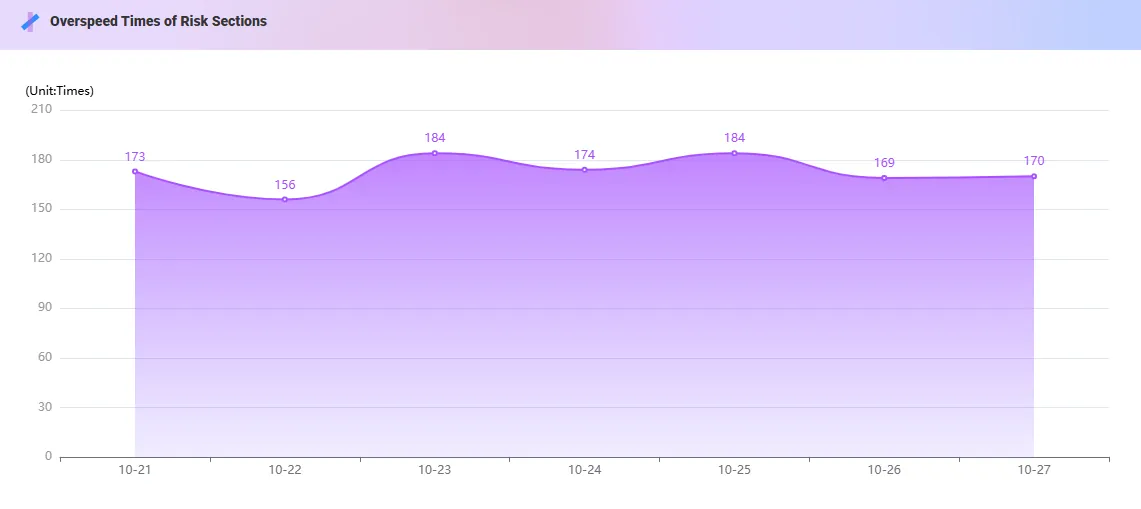
2.9 Overspeed Times of Risk Sections
Demonstrate the specific number and trend of speeding of vehicles on risky road sections.
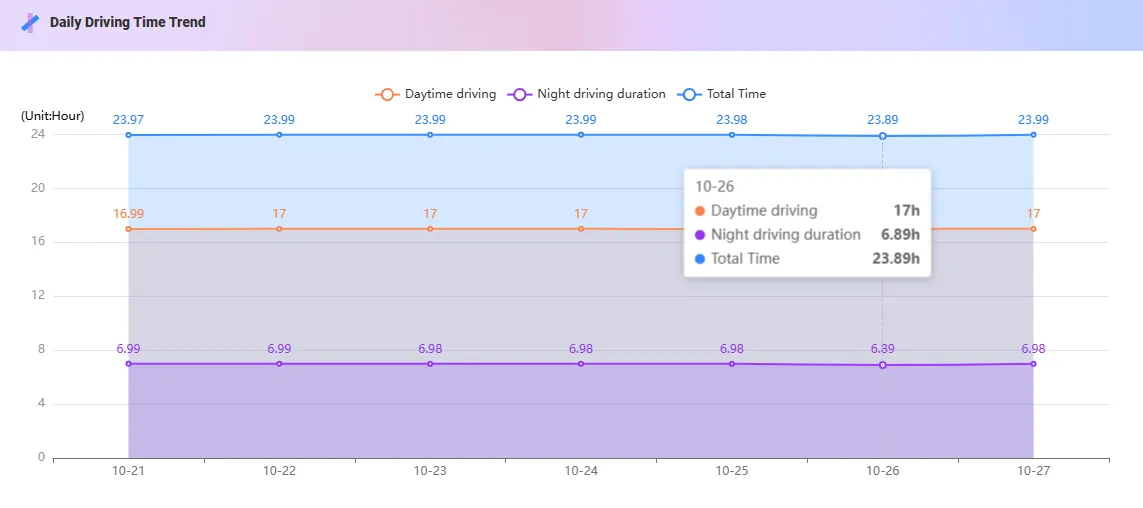
2.10 Driving Time Trend
Show the change curve and composition of the vehicle's daytime driving, night driving and total driving time.
2.11 security QRcode
Support mobile phone to scan security QR code and view comprehensive risk profile report through H5 webpage